
scE2G: linking enhancers to their target genes from single-cell data
Introducing scE2G: a model to link enhancers to their target genes using single-cell data, with state-of-the-art performance across multiple perturbation benchmarks.
scE2G tackles the challenge of building cell-type-specific maps of enhancer–gene regulation. If we can do this well, we can build enhancer maps across thousands of human cell types from emerging single-cell atlases — to interpret genetic variants and understand gene regulation in tissues that are only practically accessible to single-cell methods.
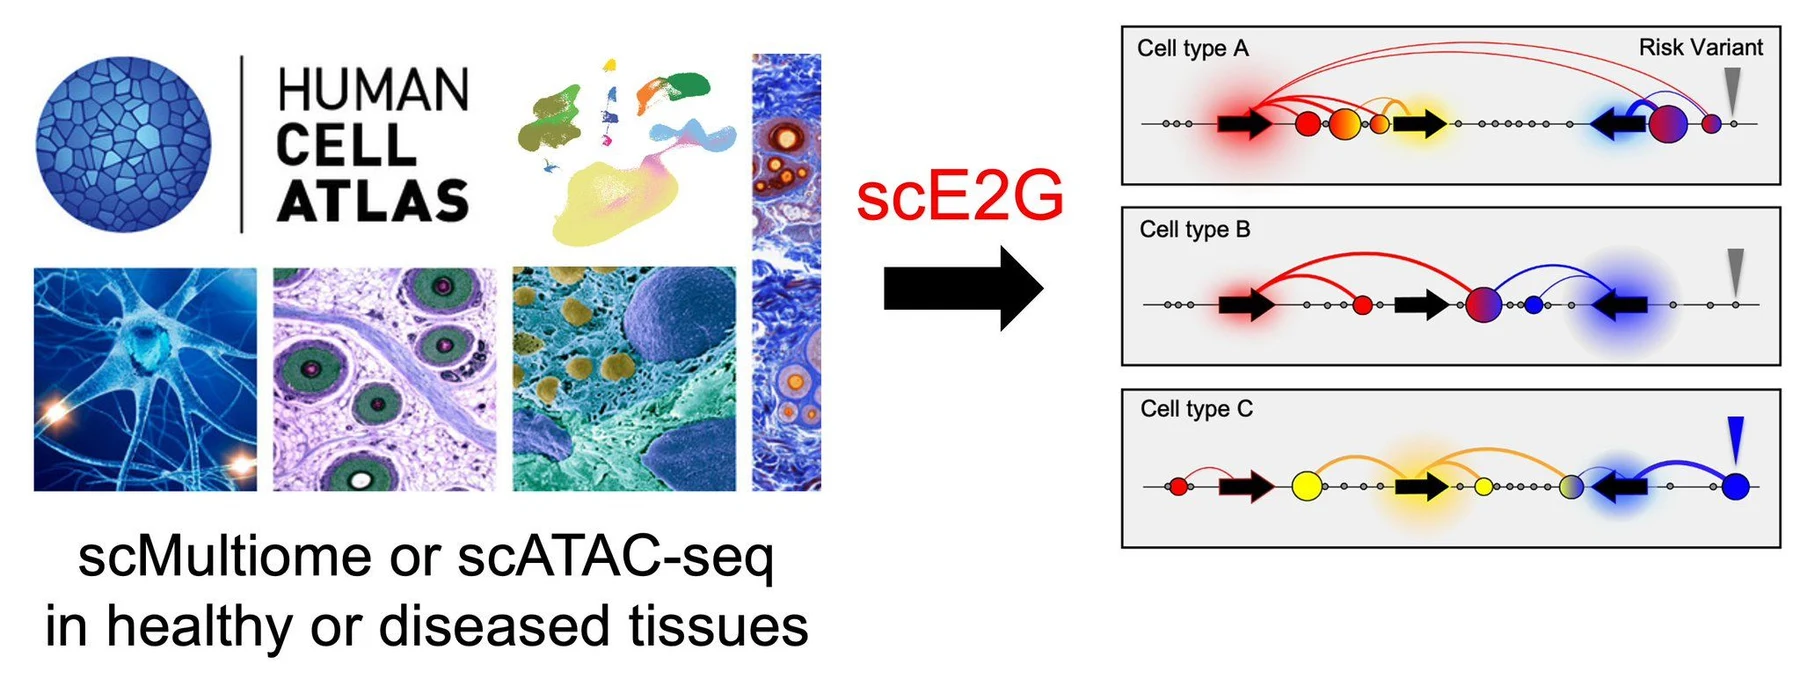
Two models, trained on CRISPR ground truth
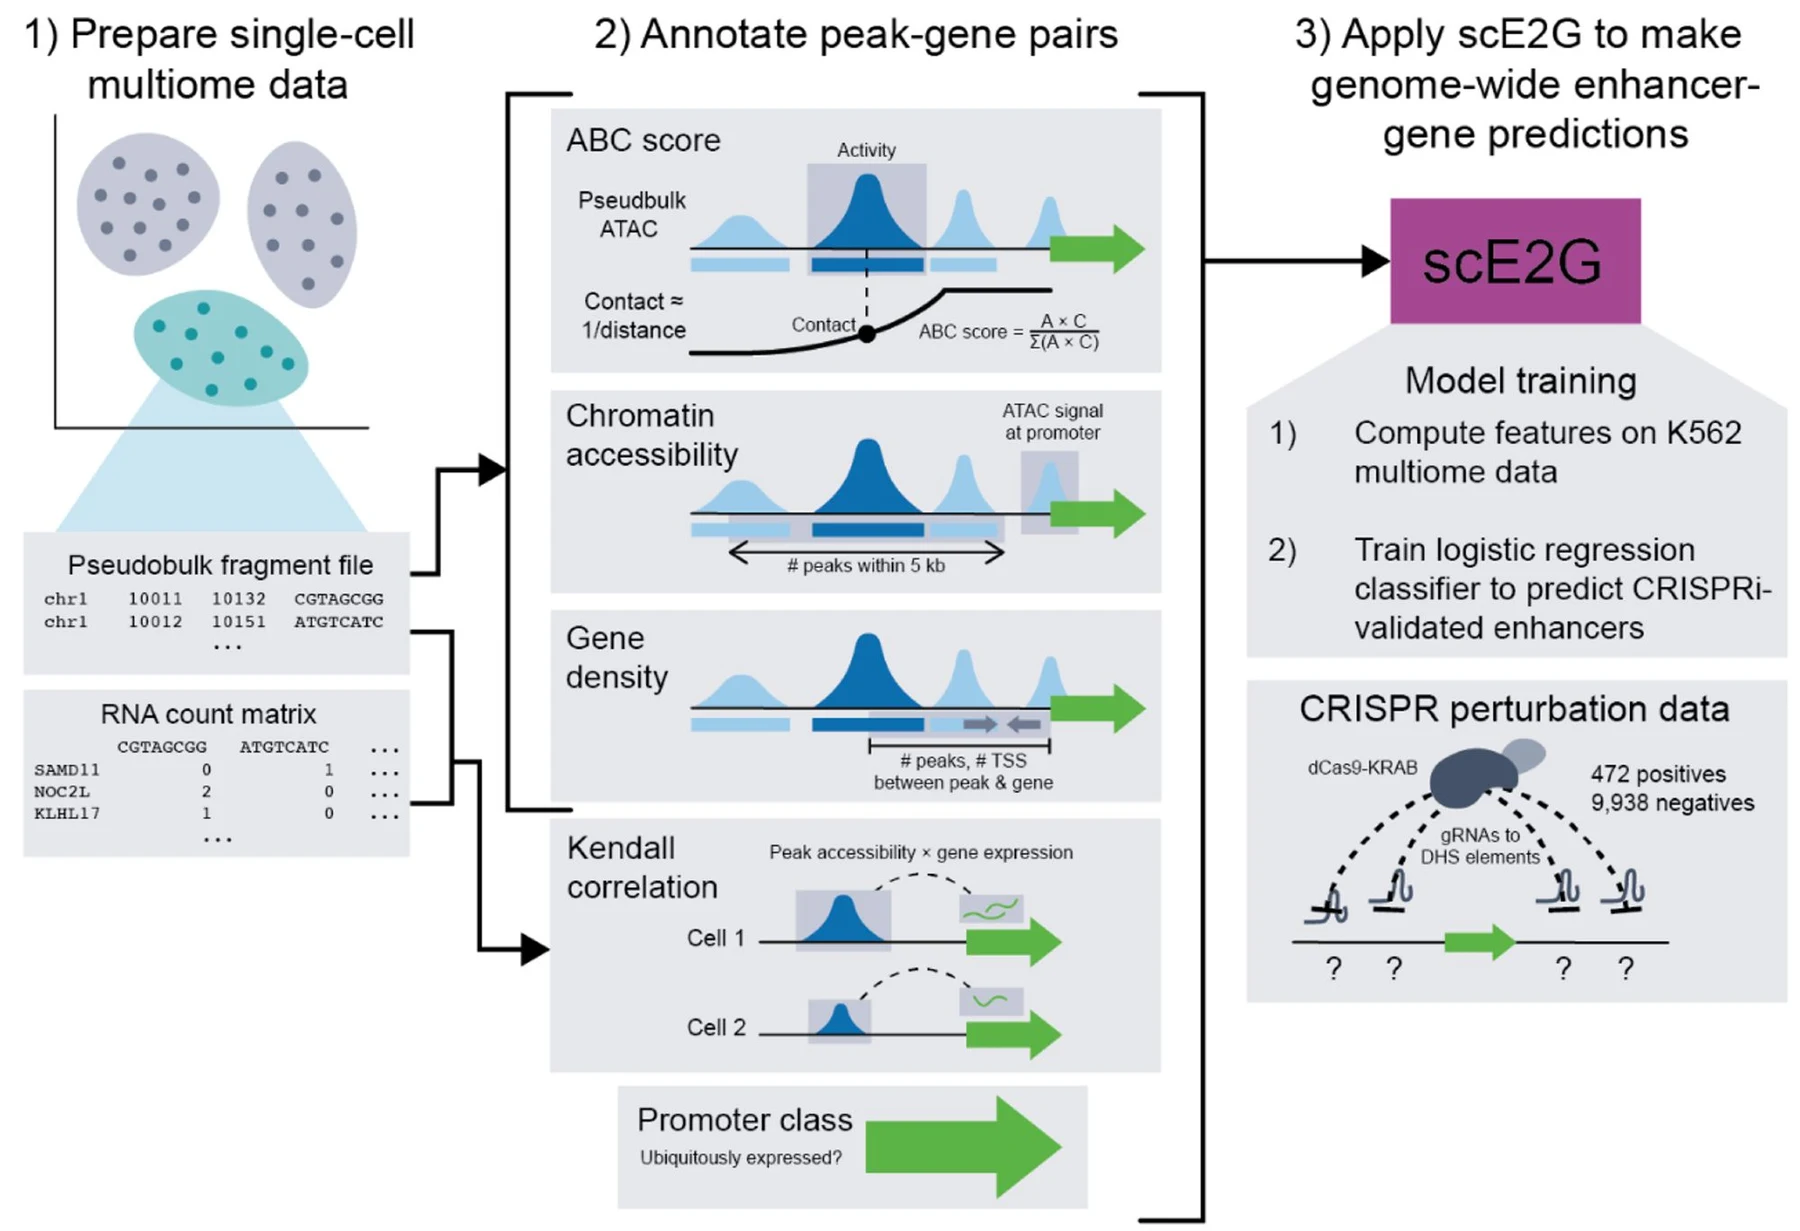
Using a gold-standard CRISPR perturbation dataset of more than 10,000 evaluated element–gene pairs, we trained two logistic regression models: scE2G (ATAC) and scE2G (Multiome), which use single-cell ATAC-seq or single-cell multiomic ATAC and RNA-seq data respectively.
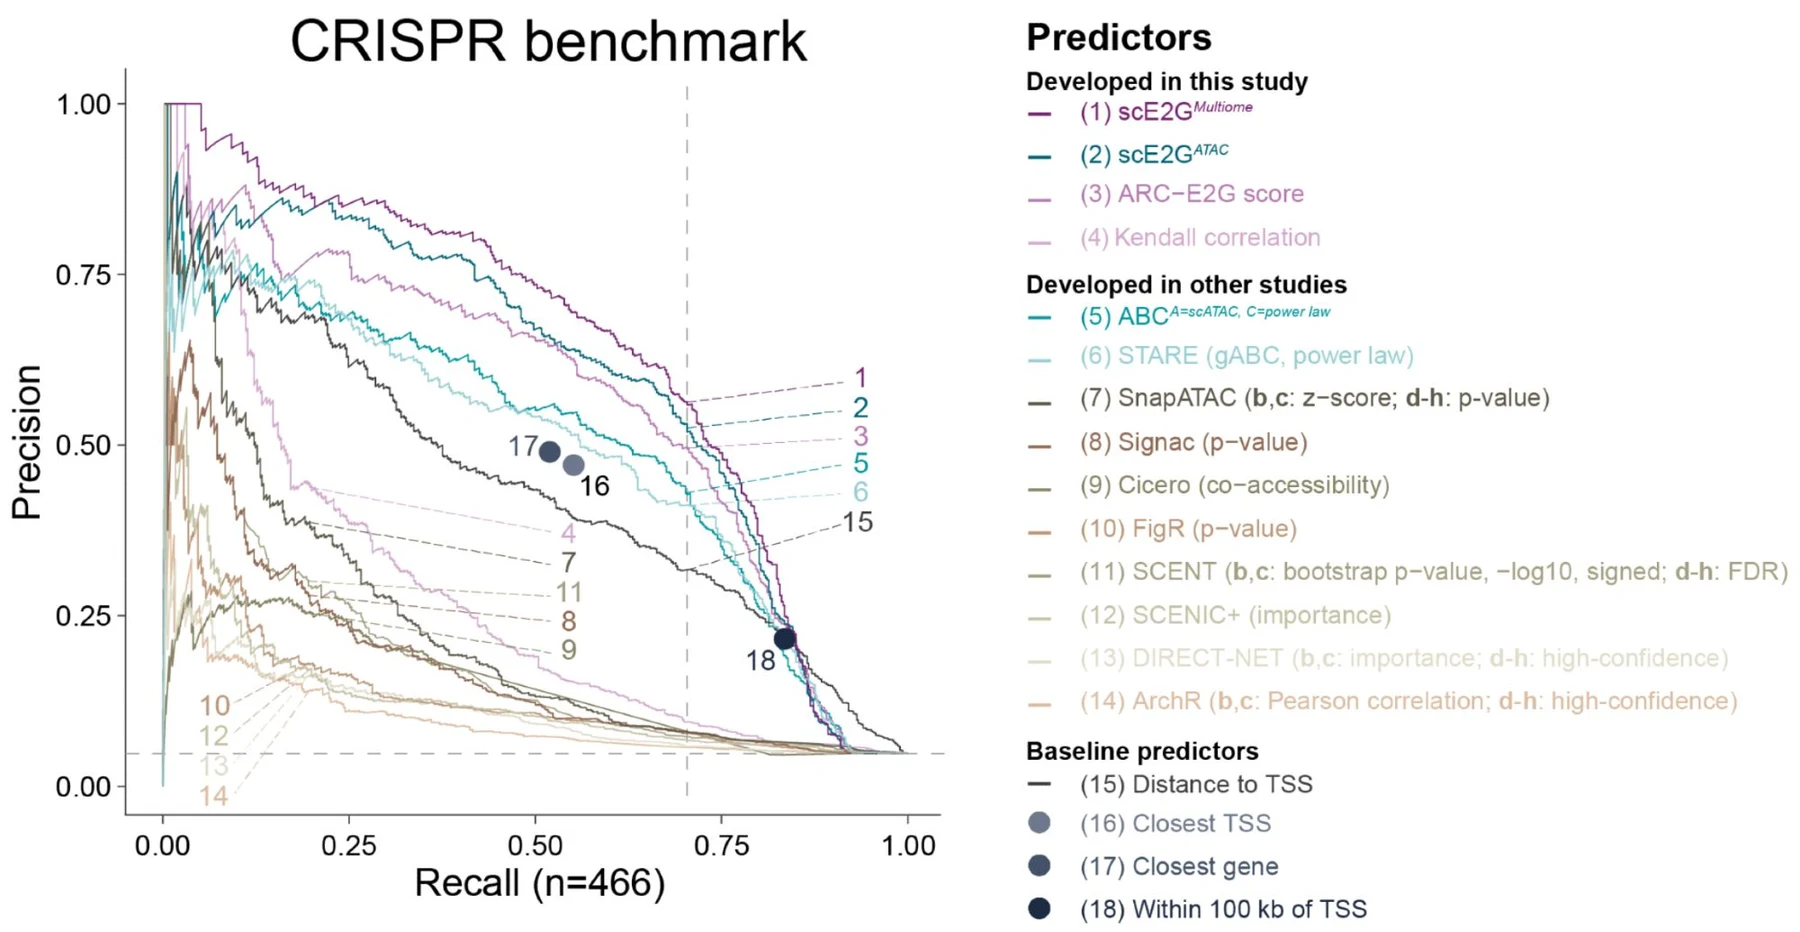
Benchmarking
In systematic benchmarking against CRISPR perturbations, fine-mapped eQTLs, and GWAS variant–gene associations, the scE2G models outperform existing single-cell models and distance-derived baselines. We applied and extended the benchmarking pipelines built for ENCODE-rE2G.
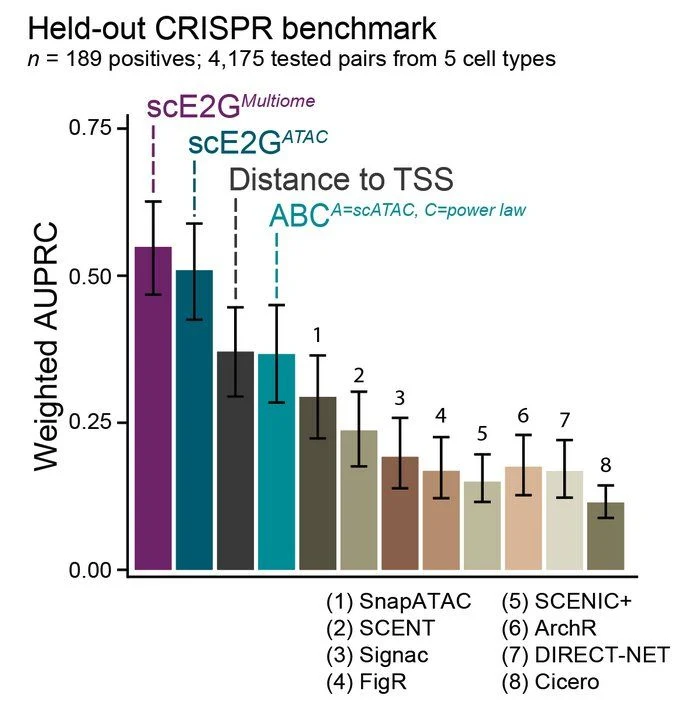
For the published version we added a benchmark on a fully held-out CRISPR dataset — 189 positives among 4,175 tested pairs from five cell types, none of them used in training. scE2G continues to show state-of-the-art performance, reinforcing that it generalizes well.
What the model learns
Key features in scE2G include the ABC score, the Kendall correlation between peak accessibility and gene expression, and whether the gene is “ubiquitously expressed.”
Notably, the Kendall correlation improves long-range predictions and appears to detect stochastic transcriptional bursting — which is why it needs genuinely single-cell resolution rather than aggregated meta-cells.
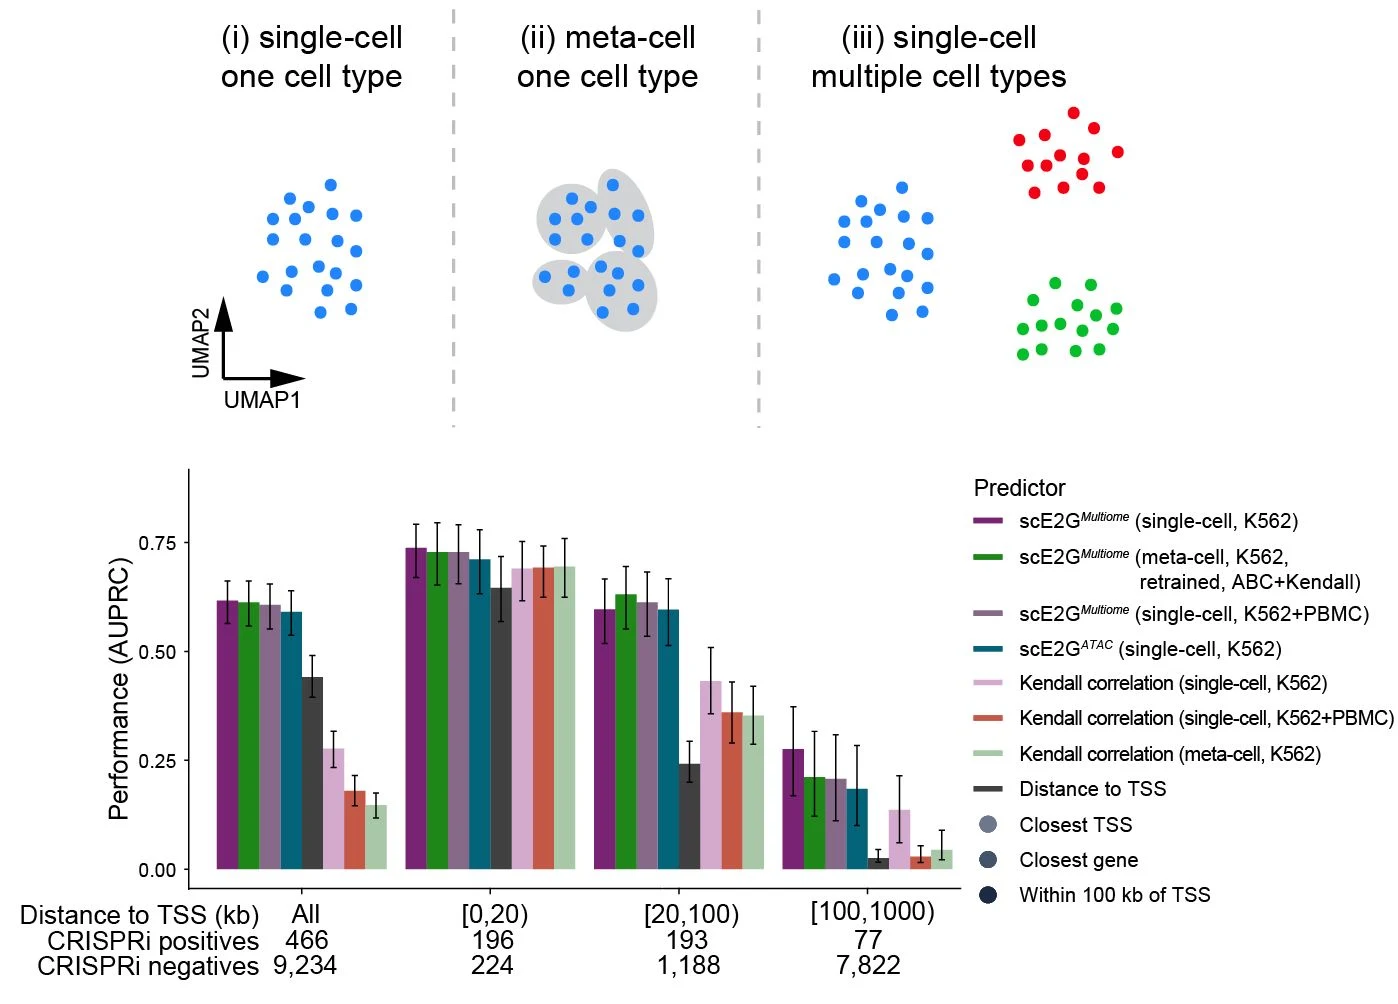
How much data do you need?
scE2G has robust performance for cell types with at least 2 million total ATAC fragments and 1 million RNA UMIs — about 200–400 cells from a typical 10x Multiome experiment in a tissue. That is a low enough bar to apply it to most annotated cell types in a well-powered atlas.
Applying it across cell types
We applied scE2G to more than 40 cell types from PBMCs, BMMCs and pancreatic islets, validating that its predictions reflect expected patterns of cell-type specificity — predictions cluster by lineage, and the enrichment of fine-mapped eQTLs rises as the prediction’s cell type more closely matches the eQTL’s.
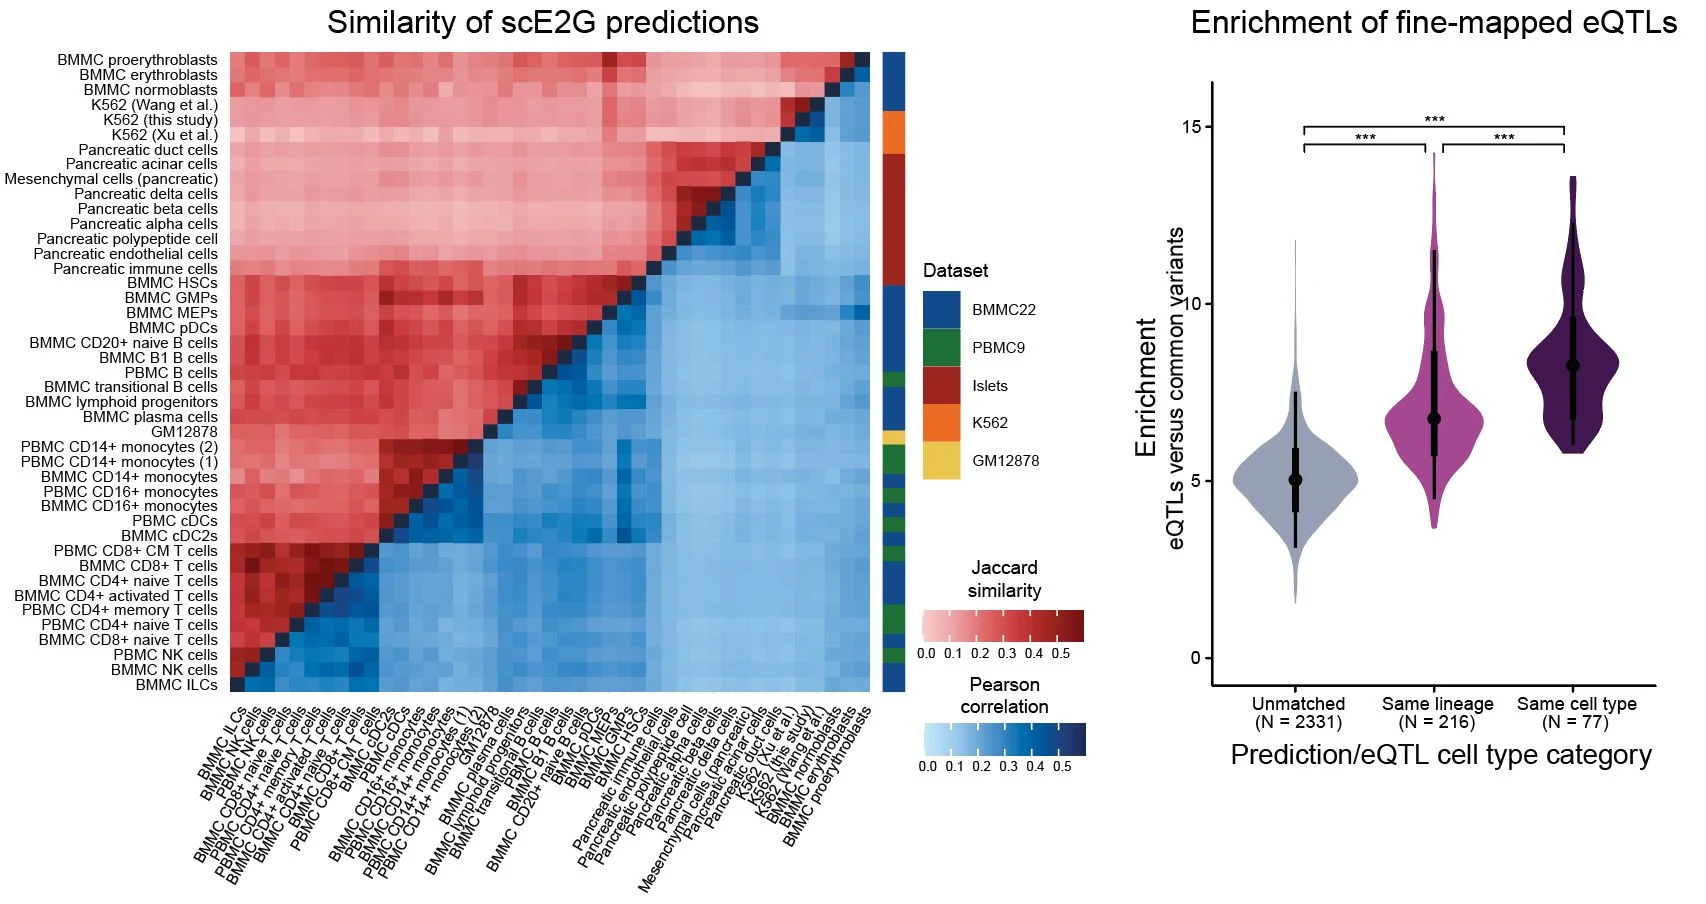
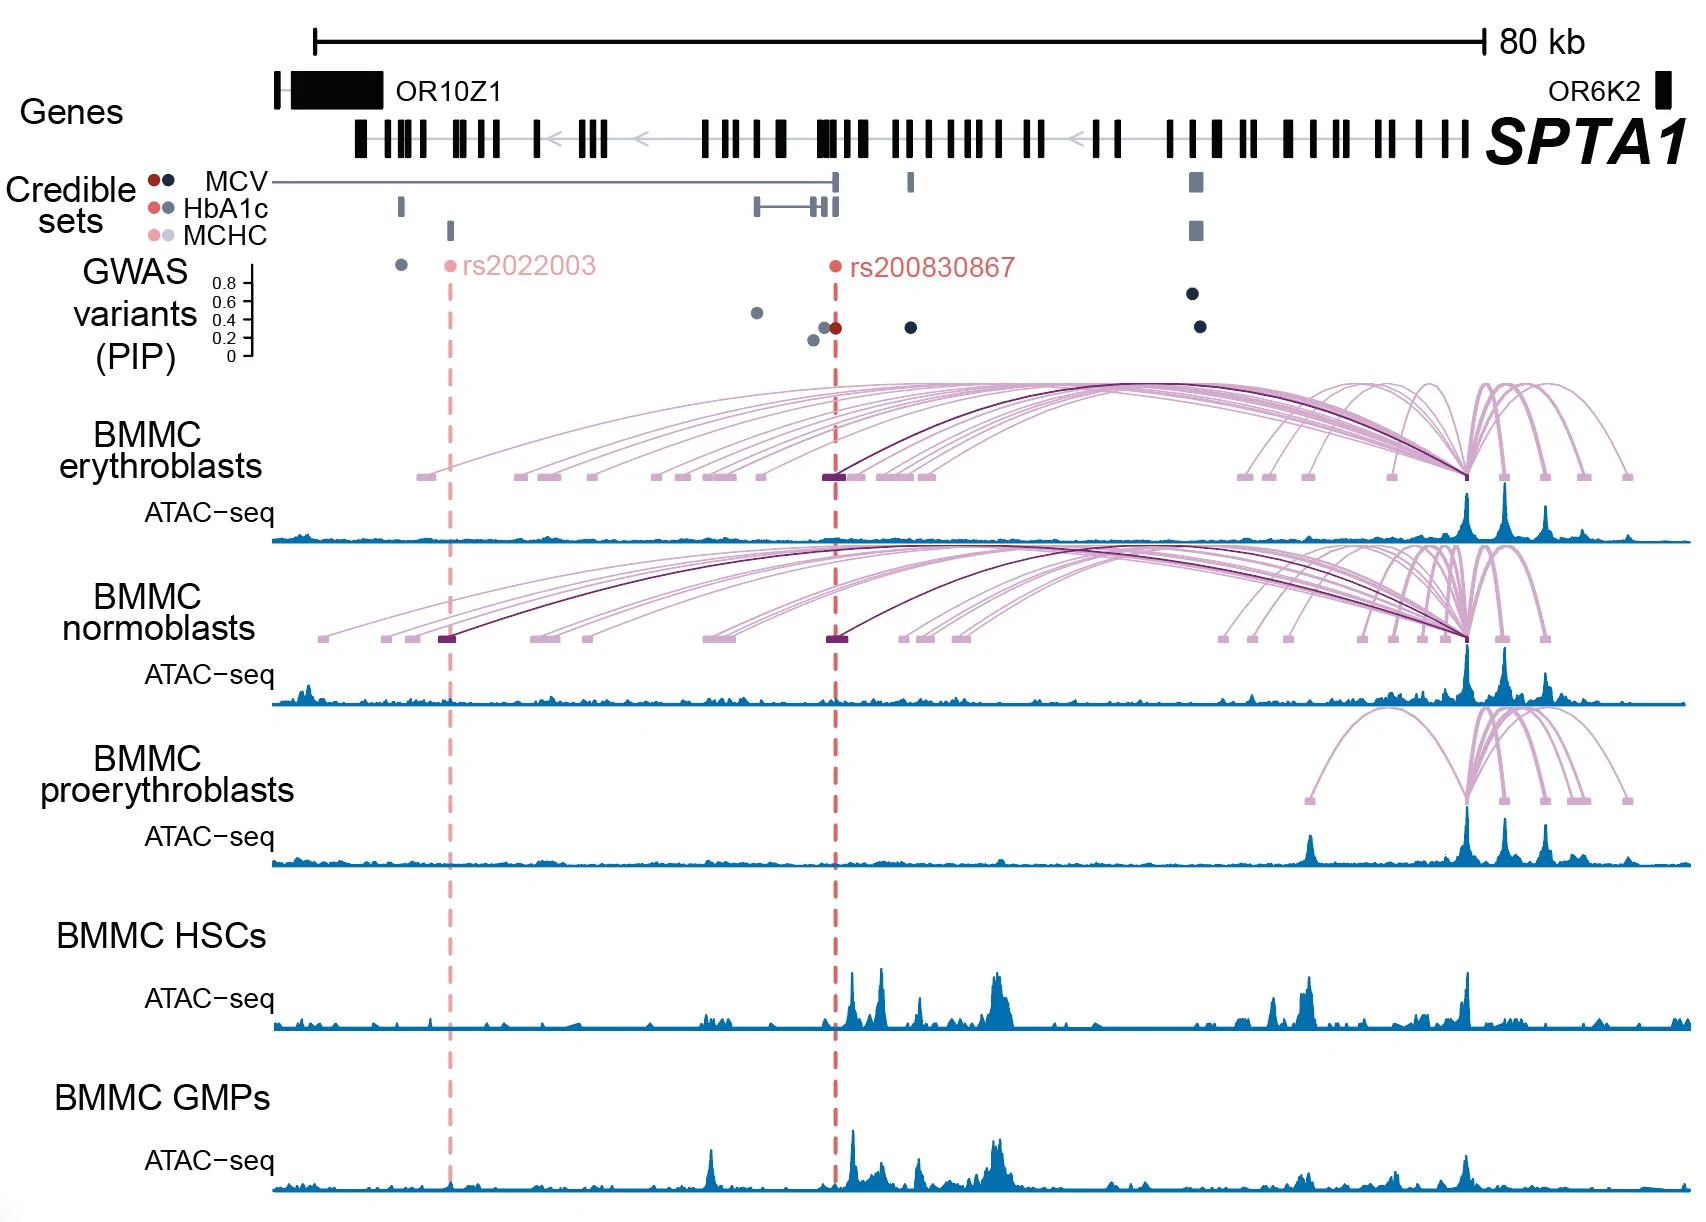
For example, we identify cell-type specific links for SPTA1 — a red blood cell membrane gene — in erythroblasts and normoblasts, but not in the progenitors upstream of them.
Prioritizing causal genes and cell types for disease variants
We also integrate scE2G predictions with orthogonal information to prioritize causal genes and cell types for noncoding variants associated with complex traits. For example, we nominate regulatory interactions linking INPP4B and IL15 to lymphocyte counts in T cells — and the risk allele is predicted to strengthen a TP73 binding motif.
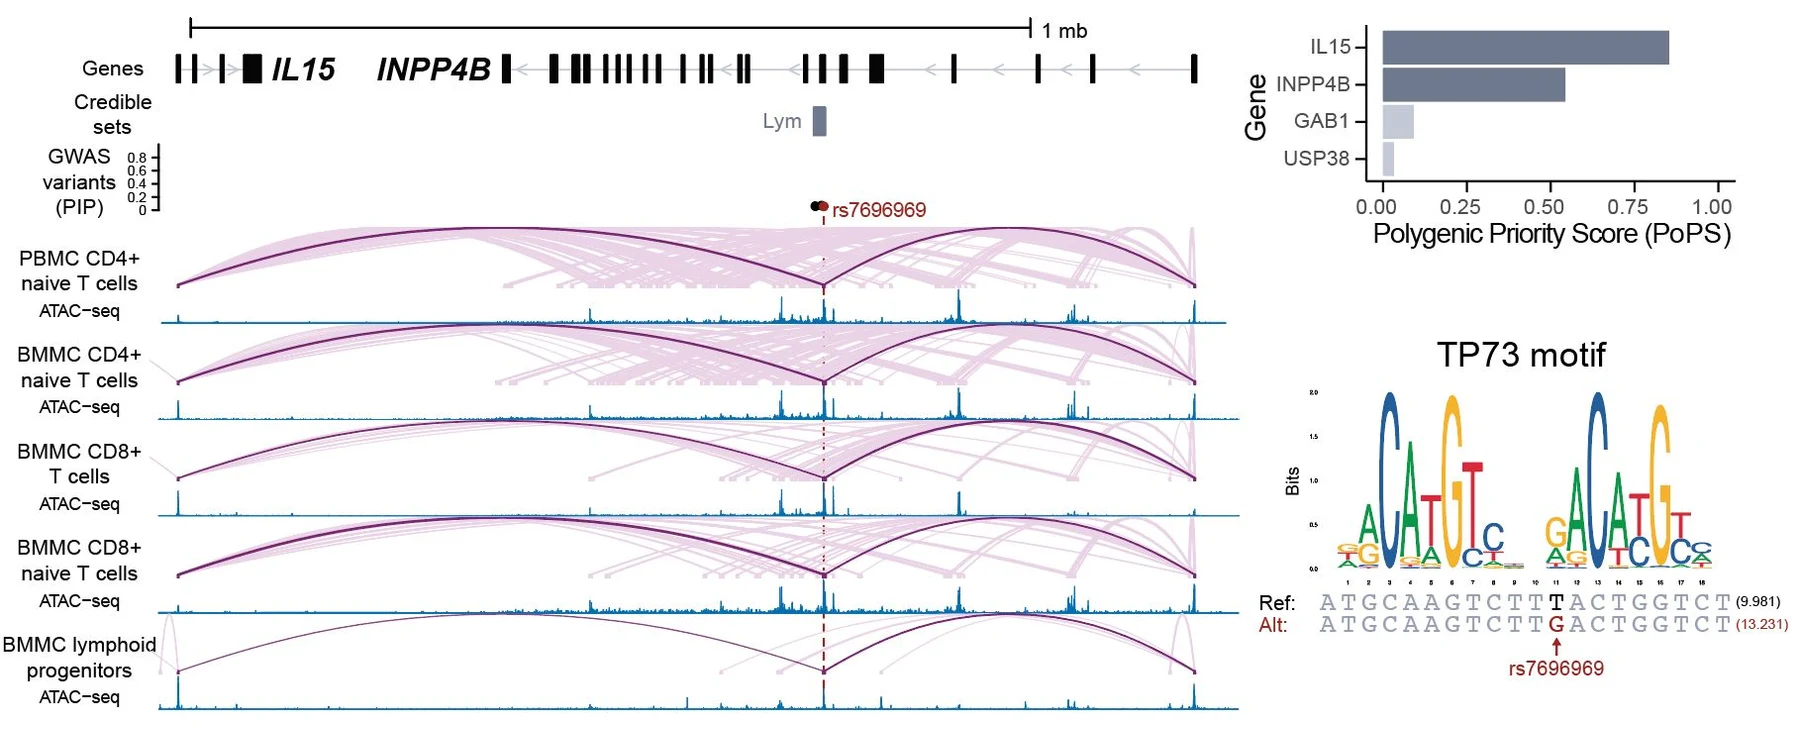
We have also applied scE2G to identify and validate disease-related enhancers in the human coronary artery and the fetal heart.
Which model should you use?
scE2G complements the ENCODE-rE2G model published in Nature:
- Bulk DNase-seq, ATAC-seq, H3K27ac and/or Hi-C → run ENCODE-rE2G
- Single-cell ATAC-seq, or multiomic ATAC + RNA → run scE2G
Same pipeline as the preprint, so if you have single-cell ATAC or multiome data you can run scE2G on it today. We look forward to hearing how it works on your dataset.
This was a wonderful collaboration led by co-first authors Maya Sheth and Wei-Lin Qiu, with Robin Andersson and Jesse Engreitz, and made possible by support from the Novo Nordisk Foundation, the IGVF Consortium, CZI, NSF and NHGRI.
Read the paper in Nature Genetics (58, 1941–1952) · Browse predictions across hundreds of cell types at e2g.stanford.edu · Code on GitHub.
This write-up is adapted from Wei-Lin Qiu’s thread on the preprint (Bluesky, X) and Jesse Engreitz’s thread on the published paper (Bluesky, X).
Figures from Sheth, Qiu et al., Nature Genetics 58, 1941–1952 (2026), CC BY 4.0; some panels cropped.